Core Web Vitals have existed since 2020, and in a few years they have become the common reference for talking about web performance: developers, marketing managers, agencies and clients use the same three names, LCP, INP and CLS, and the same thresholds. For exactly this reason, every time Google announces a change, the industry asks itself: what will change, when, and what needs to be done?
Predicting the future in detail is impossible, but the history of these years and the way the program is organized make it possible to understand how the metrics evolve, which directions are already visible and how to prepare without chasing every novelty. In this article we retrace the changes that have happened, explain the life cycle of a metric, look at the areas under experimentation and propose a way of working that stays valid whatever happens.
Where we come from
Before Core Web Vitals, performance metrics were many and uneven: full load time, time to first byte, visual speed indexes, aggregate scores. Each tool measured in its own way, and comparisons were hard. In 2020 Google proposed a reduced set of metrics, chosen with a few precise criteria: centered on the user experience, measurable on real users, representative of distinct aspects of the experience. The first three were Largest Contentful Paint for loading, First Input Delay for responsiveness and Cumulative Layout Shift for visual stability.
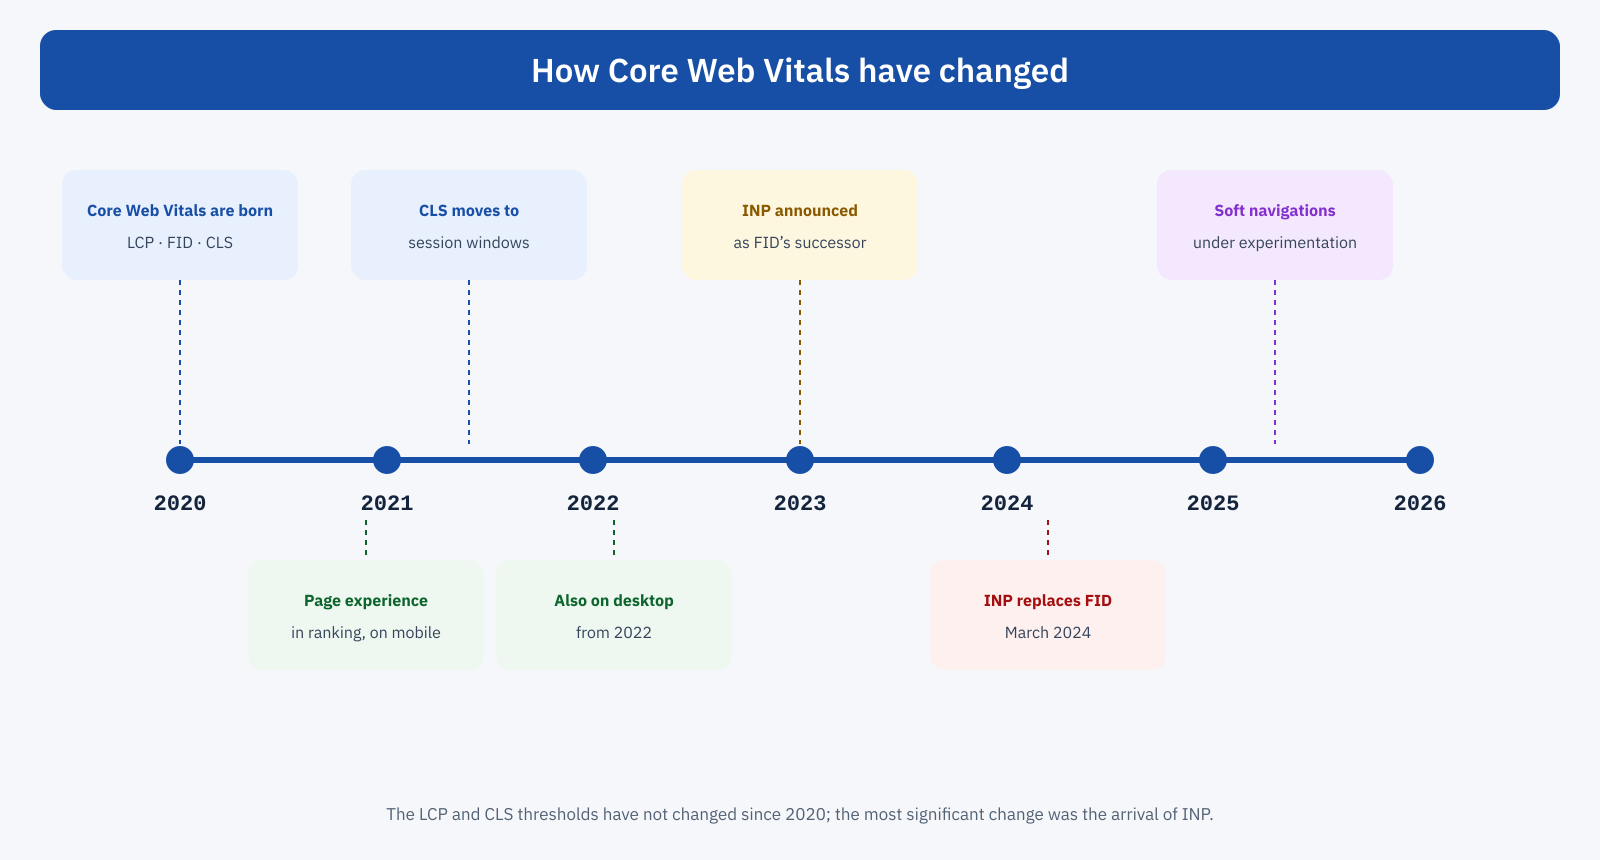
Since then the changes have been few but significant. In 2021 page experience became one of the ranking signals for mobile searches, and the following year for desktop too, as we saw in the article on Core Web Vitals and SEO. Also in 2021 the calculation of CLS was changed: instead of summing all the shifts in the life of the page, it considers the worst session window, a change that made the metric fairer for long pages and extended sessions. In 2023 Google announced INP as the successor to FID, and in March 2024 the replacement took effect.
The lesson of FID
The move from FID to INP is the most instructive case for understanding how metrics evolve. FID measured only the delay before the browser began to handle the user’s first interaction, not the overall time to show the response, and ignored all later interactions. It was easy to pass: the great majority of sites got good values, even when users clearly perceived slow interfaces. The metric, in other words, did not describe well the experience it was meant to represent.
INP considers all the interactions of the visit and measures the time until the response is painted. It is a much more demanding metric, and at the time of the replacement many sites that were rated good with FID moved to needs improvement without any change. The lesson is clear: whoever had optimized for the number, exploiting FID’s limits, found themselves exposed; whoever had worked on real responsiveness, reducing JavaScript and long tasks, went through the change without problems.
The life cycle of a metric
To make changes predictable, Google has described a life cycle for the metrics of the Web Vitals program. A metric is born experimental: it is proposed, implemented in the browser, discussed with the community and corrected based on the data collected. If it proves useful and reliable, it becomes pending: it is announced as a future Core Web Vital, with a notice period that lets sites prepare. Finally it becomes stable and enters assessments. A stable metric can be retired when a better one arrives, as happened to FID.
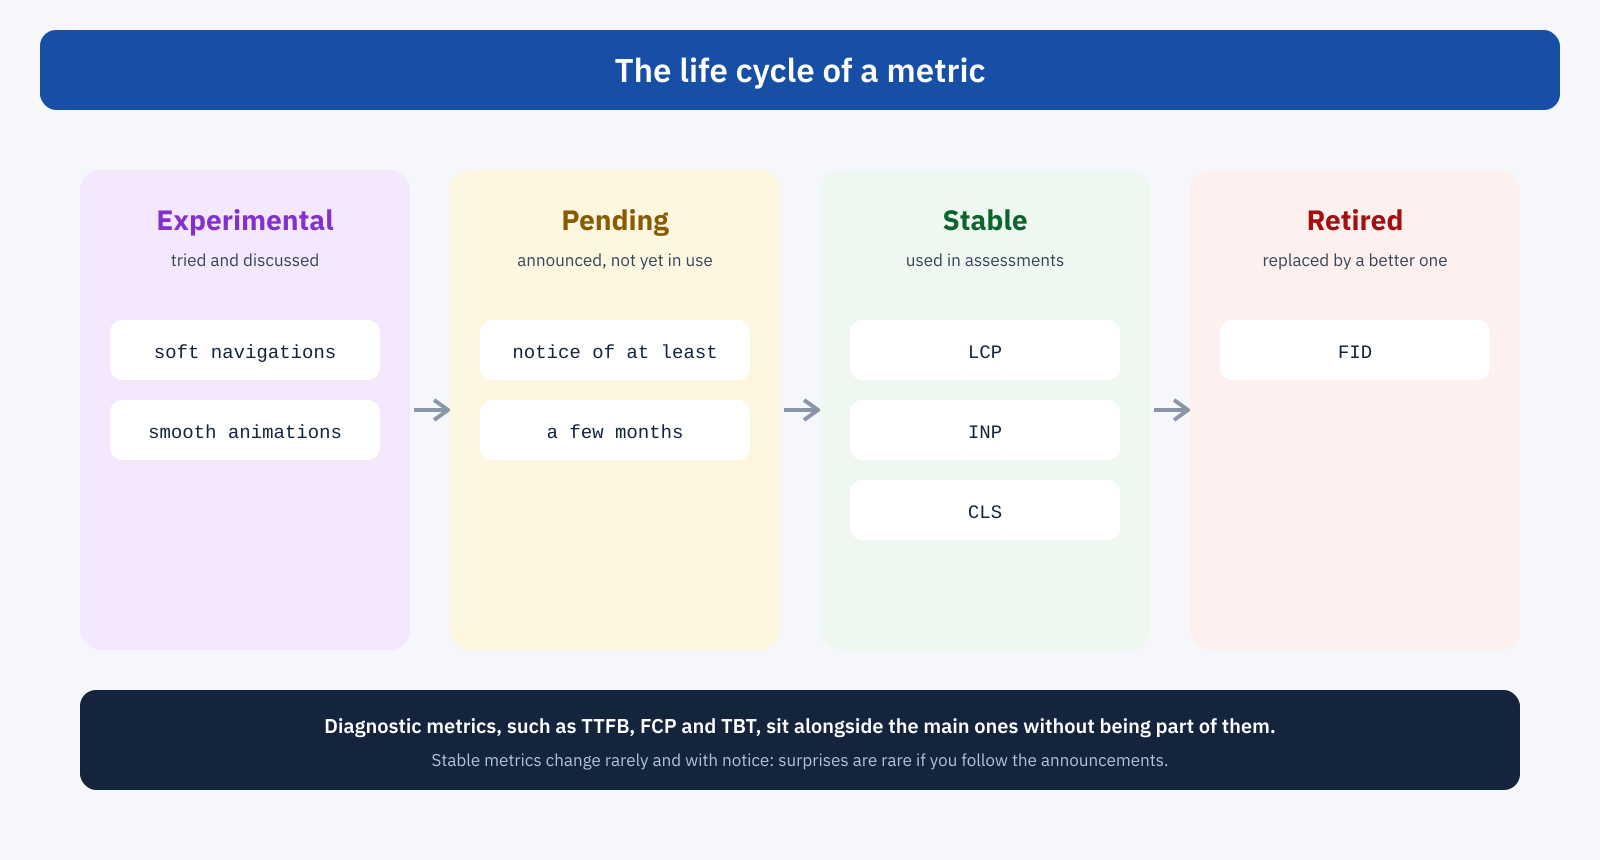
Google has also indicated that stable metrics change no more than once a year, and always with advance notice. Alongside Core Web Vitals there are also diagnostic metrics, such as TTFB, First Contentful Paint and Total Blocking Time: they are not part of the assessment, but they help understand the causes of problems. Not every novelty, then, is destined to become a Core Web Vital: many remain diagnostic tools, useful for those who work on performance but with no consequences for the assessment.
Details change too
Besides the announced changes, the browser’s implementations of the metrics are updated periodically to fix particular cases: which elements can be LCP candidates, how to treat background images with low informational content or initially transparent elements, how to count shifts caused by certain animations. These updates are documented in a public changelog of metric changes, and usually have small effects. They can, however, explain sudden changes in field data not linked to changes on the site, and it is useful to know where to check them.
Directions already visible
Soft navigations
The most advanced area of work concerns single-page applications. Today, as we saw in the article on Single Page Applications, the internal navigations of these applications do not produce new loading measurements, and CLS and INP accumulate over the whole session. Chrome has been experimenting for some time with a mechanism to recognize these navigations and measure them as separate pages. If it became stable, it would significantly change the values of many sites built with JavaScript frameworks: some pages would improve, because the session’s problems would no longer be attributed to the entry page, others would get worse, because slow navigations that are invisible today would finally be measured.
Attribution of causes
A second direction is not about new metrics but about the ability to understand the existing ones. The Long Animation Frames API, available in Chrome, shows which scripts contribute to slow frames and therefore to slow interactions; the attribution builds of measurement libraries break LCP and INP down into their phases. It is a trend that makes the metrics more usable, shifting attention from “how much” to “why”, and it will probably continue.
Smoothness
One aspect of the experience that current Core Web Vitals do not directly cover is smoothness: animations and scrolling that proceed in fits and starts, frames dropped during a transition. The topic has been explored several times with experimental metrics, without so far arriving at a stable proposal. It is plausible that something will emerge in this direction in the future, also because APIs like the long animation frames one already provide part of the data needed.
Beyond Chrome
The APIs the metrics are based on were born in Chromium, and for years only browsers based on that engine supported them. In recent years other engines have begun to implement some of them, and standardization work in the W3C groups continues. Broader support would make it possible to measure the performance of users of all browsers with the same tools, an advantage above all for sites with many visitors from Apple devices, today partly invisible to Chrome UX Report data.
Could the thresholds change?
A frequent question concerns the thresholds: 2.5 seconds for LCP, 200 milliseconds for INP, 0.1 for CLS. They were chosen based on research into user perception and on their attainability by a significant share of sites, and have not changed since 2020. As networks and devices improve and sites get optimized, the share of pages in the good state grows, and it cannot be ruled out that the thresholds will become more demanding in the future. Even then, though, the change would follow the same cycle of announcement and notice as the metrics, and whoever has values well inside the current thresholds, and not just under the limit, would have little to fear.
What it means for a WordPress site
For those running a WordPress site, the evolution of the core goes in the same direction as the metrics: selective loading of block styles, automatic priority for the main image, support for speculative page loading, JavaScript modules loaded only when needed. Following WordPress updates, preferring themes and plugins that adopt these features and reducing dependencies on dated code is, in effect, a way of preparing for future metrics too.
How to prepare
The lesson of FID suggests the most robust strategy: optimize for the experience the metrics try to describe, not for the metrics themselves. A site with a fast server, light pages, little JavaScript run at the right moment, a stable layout and interactions that respond immediately will get through any metric change without surprises, because every new metric will try to describe these very qualities better. Conversely, optimizations that aim to exploit the limits of a metric, as we saw when discussing performance cloaking, are the first to become useless when the metric changes.
On a practical level, a few habits help avoid being caught by surprise.
- Measure experimental metrics. A Real User Monitoring system can collect, besides the stable metrics, those under experimentation: when one of them is announced, you already know your own values and have months of head start.
- Follow official sources. Announcements on the Web Vitals program, the metrics changelog and the monthly Chrome UX Report release notes are enough to know in advance what will change.
- Watch the diagnostic metrics. TTFB, Total Blocking Time and the breakdowns of LCP and INP point to problems that will probably become relevant for future metrics too.
- Maintain budgets. A performance budget on the amount of JavaScript, page weight and number of third-party scripts protects the site’s underlying qualities, regardless of the metrics used to assess them.
What probably will not change
More interesting than what will change, perhaps, is what will remain. The three questions Core Web Vitals answer, how quickly the main content appears, how quickly the page responds, how stable what you see is, describe fundamental aspects of the experience of anyone using a site, and are unlikely to lose importance. The metrics may become more precise, cover more cases, extend to more browsers; the qualities they measure will stay the same. As will the program’s underlying principle: measure the experience of real users, not the behavior of the site in a lab.
The link with business is also unlikely to change. A fast, stable and responsive site retains more visitors, converts more and costs less to run, whatever way Google decides to assess it, as we saw in the article on the economic return of performance. The metrics are the thermometer; the health of the site is what matters.
In short
In a few years Core Web Vitals have changed little but significantly: CLS moved to session windows, INP replaced FID, the LCP and CLS thresholds have stayed stable. Changes follow a public life cycle, from experimentation to stability, with notice periods of months, and stable metrics change no more than once a year. The directions already visible concern soft navigations, attribution of causes, smoothness and support in other browsers.
The best way to prepare is the same one that is needed today: work on the real experience and not on the number, measure real users even with experimental metrics, follow official sources and protect the site’s underlying qualities with budgets and checks. Whoever does so need not fear the future of Core Web Vitals: every new metric, in the end, will only try to describe better what that site is already doing well.
