Anyone working on a site’s performance sooner or later faces the same question, asked by a director, a marketing manager or a client: what does it cost us, and what does it return? It is a legitimate question. A web performance project takes development hours, sometimes a change of hosting or theme, monitoring tools, continuing attention over time. Answering “it improves Core Web Vitals” or “the PageSpeed score goes from 40 to 90” is not enough: decision makers think in revenue, margins and payback time.
In this article we propose a method for estimating the economic return of a performance project honestly: starting from the site’s own data, with cautious and stated assumptions, distinguishing what can be measured from what remains an estimate. It is the same reasoning we apply when we present an intervention, and it makes the conversation with decision makers much easier.
What the studies say
The link between speed and business results has been documented many times. The “Milliseconds Make Millions” study, carried out by Deloitte with Google in 2020, observed that an improvement of a tenth of a second in mobile load times was associated, in retail, with an increase in conversions of about 8%, and with similar effects in the travel sector. Several cases published by Google describe companies that, after improving LCP or INP, recorded increases in sales or leads in controlled tests. And research on user behavior shows that the probability of abandonment grows quickly when mobile load time goes from one to three seconds.
These figures are useful for giving an order of magnitude and for convincing people that the topic deserves attention, but they should not be transferred mechanically to your own site. Sectors, audiences, devices and starting points differ, and a site that is already fast will not get the same results as a very slow one. The return of a project is better estimated with the site’s own data.
Start from your own data
The most solid starting point is to observe how the site’s users behave at different speeds. With a Real User Monitoring system connected to analytics, or even just with the speed data of some analytics platforms, you can split sessions by LCP or INP band and compare the conversion rate of each band, on the same page template and the same type of device.
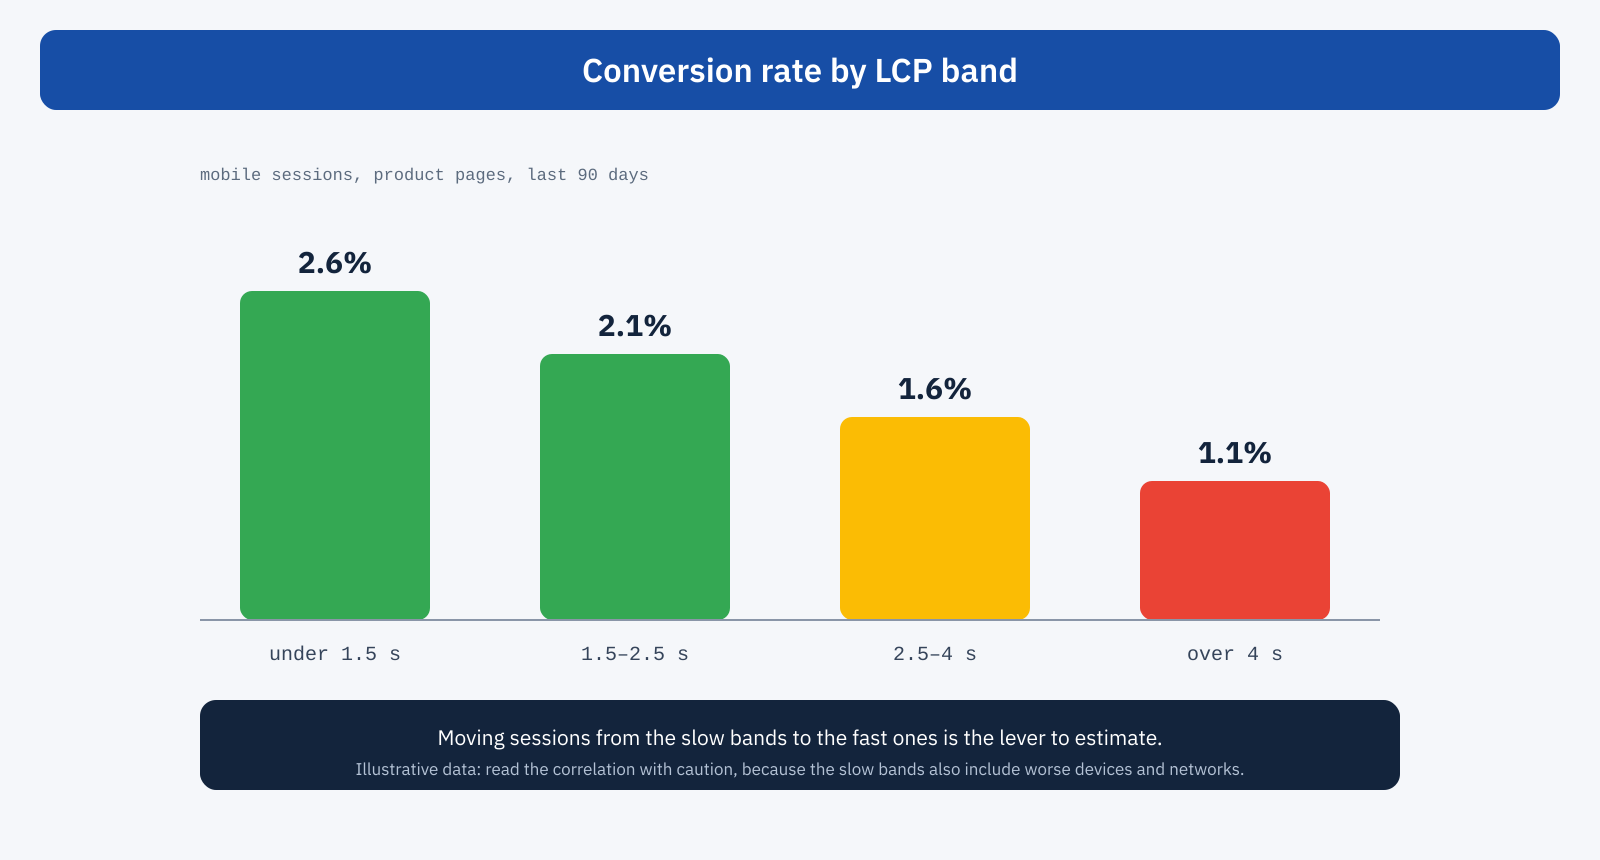
A chart like this almost always shows the same trend: faster sessions convert more. But be careful not to attribute the whole difference to speed. Slow sessions more often include budget devices, worse networks, users on the move, that is, groups that might convert less even with an instant site. The difference between bands is an upper limit of the possible benefit, not a forecast. For this reason, in the model, it is best to use only a fraction of that difference.
The estimation model
For an e-commerce site the simplest model is the revenue one: sessions times conversion rate times average order value. A performance project acts mostly on the conversion rate, and to a lesser extent on sessions, for example by reducing abandonment before the page has fully loaded. The key step is choosing a plausible improvement in conversion rate.
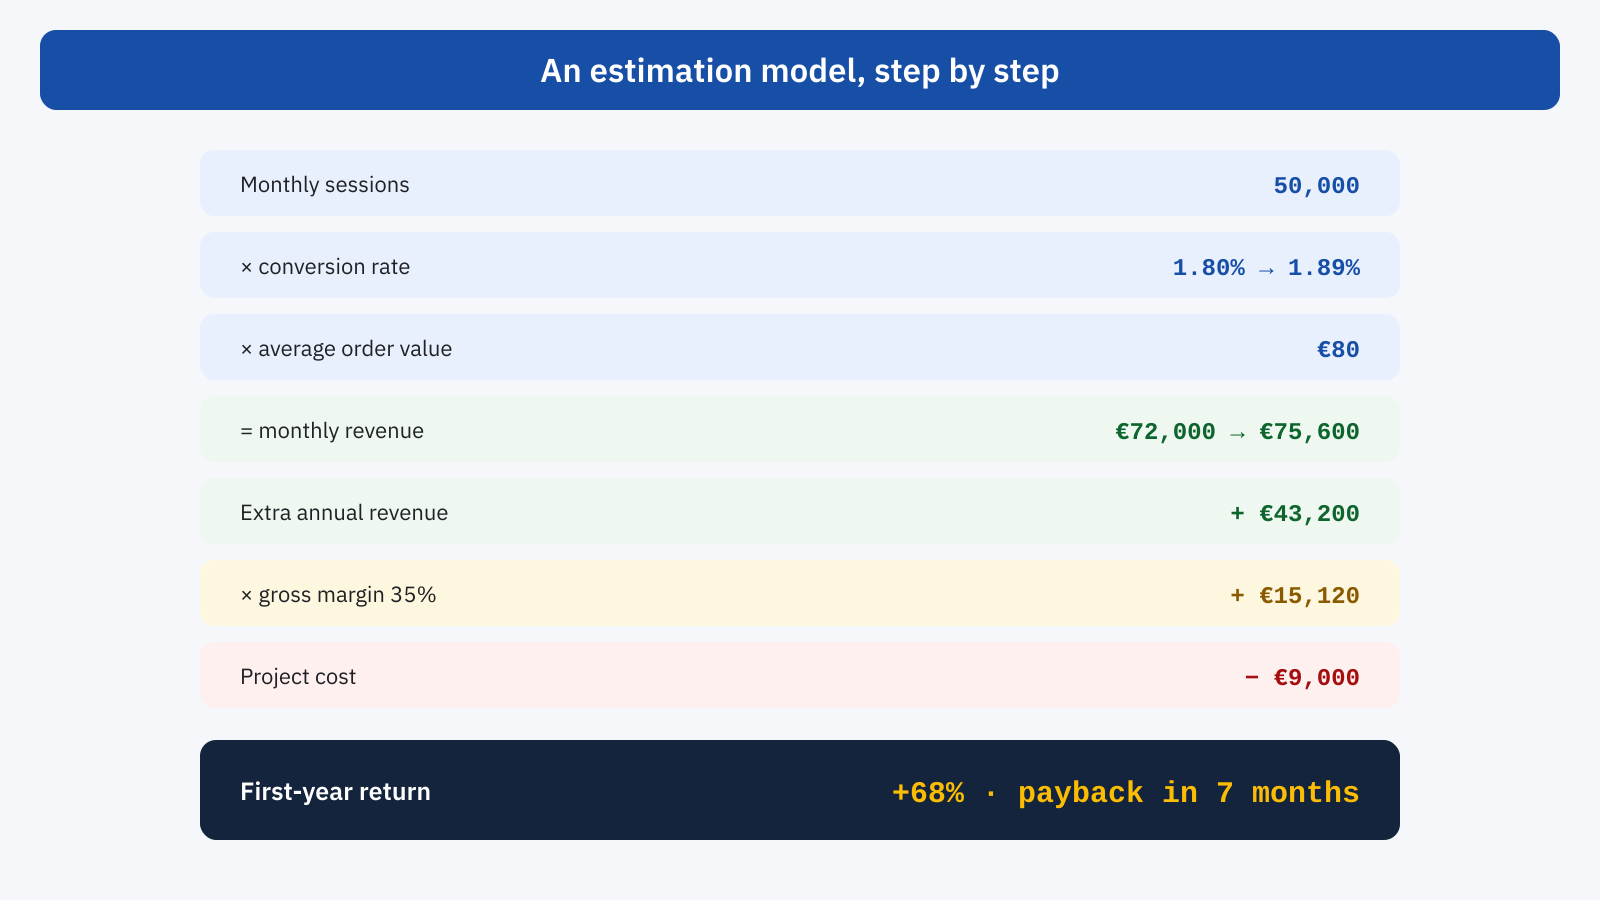
In the example, a store with 50,000 sessions a month, a conversion rate of 1.80% and an average order value of €80 generates €72,000 a month in revenue. We assume a relative increase of 5% in conversion rate, which moves to 1.89%: a cautious value compared with both the published studies and the difference observed between speed bands. Monthly revenue rises to €75,600, for an extra annual revenue of €43,200.
A frequent mistake is to compare the project cost with the additional revenue. The correct comparison is with margin: applying a gross margin of 35%, the annual benefit is about €15,000. With a project cost of €9,000, the first-year return is about 68%, and the investment pays back in about seven months. In later years, net of maintenance, the benefit continues.
Three scenarios instead of one number
A single figure gives an impression of precision that the estimate does not have. It is more honest, and more convincing, to present three scenarios: a cautious one, with a 2 or 3% increase in conversion rate; a likely one, around 5%; an optimistic one, close to the difference observed between speed bands. If the project pays for itself even in the cautious scenario, the decision becomes simple. If it pays for itself only in the optimistic one, it is better to reduce its scope, starting from the interventions with the best ratio of cost to benefit.
Benefits that do not go through conversions
Revenue is not the only line. Other benefits are often easier to quantify, and can by themselves justify a project.
- Paid advertising. In search campaigns, the landing page experience contributes to the quality score, which affects the cost per click. Faster pages can reduce the cost of acquisition, and every paid visitor who leaves before the page has loaded is wasted budget.
- Organic traffic. As explained in the article on Core Web Vitals and SEO, the direct effect on rankings is limited, but the effect on the value of each organic visit is concrete.
- Infrastructure. Lighter pages and an efficient cache reduce bandwidth, server resources and, in some cases, the cost of hosting or the CDN. A site that withstands peaks without adding resources avoids expense and outages.
- Internal productivity. A faster admin dashboard saves time every day for the people who manage content, orders and customers. Multiplied by the number of people and working days, it is a cost that is often underestimated.
For sites that do not sell online the reasoning is the same, with different metrics: leads generated, quote requests, sign-ups, pageviews per session on a publishing site that lives on advertising. What matters is to link speed to an indicator the organization already measures and knows how to value.
An example for a lead-generation site
Consider a services company that does not sell online but collects quote requests: 20,000 sessions a month, a lead conversion rate of 2%, that is 400 requests, of which 10% become a customer with an average first-year value of €3,000. The monthly value generated by the site is therefore €120,000 in contracts. A cautious relative increase of 4% in the lead rate brings 16 more requests a month, about 1.6 new customers, and almost €58,000 more in contracts over a year.
Here too the comparison should be made on the margin of the contracts and not on their value, and with all the costs of the project. But the example shows an important point: on lead-generation sites, where the value of each conversion is high, even small percentage improvements can justify significant investment. And often the most important pages, such as the service pages and the contact form, are few, so the intervention can be targeted and contained.
The most common mistakes in estimates
The first mistake is to apply the results of an external study to your own site without adapting them: an 8% increase observed on average across many sites is not a promise. The second is to attribute the whole difference between fast and slow sessions to speed, ignoring that they are different populations. The third is to reason on revenue instead of margin, inflating the return three or four times. The fourth is to forget that the improvement only concerns sessions that were slow: if 70% of visits are already in the good range, the effect applies to the remaining 30%.
The last mistake is the opposite one: giving up on estimating because the estimate is uncertain. A cautious estimate, with stated assumptions and scenarios, is always more useful than no estimate, because it lets you compare the project with the other possible uses of the same budget, from advertising to new content.
All the costs
An estimate of the return is credible only if the costs are complete too. Besides the initial development, you need to consider monitoring tools, any difference in hosting cost, internal time for testing and approvals and, above all, maintenance. Performance tends to worsen over time, with every new plugin, marketing script or home page section: without periodic checks, part of the benefit is lost within a few months. Planning a maintenance budget from the start makes the estimate more realistic and the result longer-lasting.
Measuring the result
After the intervention, the estimate should be compared with reality. The most rigorous method is an A/B test, in which part of the users receive the optimized version and part the original: it is the only way to isolate the effect of speed from everything else. When that is not practical, a before-and-after comparison is acceptable as long as it takes account of seasonality, for example by comparing with the same period of the previous year, and of other changes that happened in the same period, such as campaigns, prices or product range.
A useful indicator that is less exposed to external factors is the conversion rate by speed band, the same chart used for the estimate: if the intervention worked, sessions move toward the fast bands and the overall rate approaches that of those bands. Documenting results, even when they fall short of expectations, makes the decision on the next project easier.
Presenting the numbers to decision makers
Presentation matters as much as the calculation. A few rules help. Talk in euros and months to payback, not in milliseconds and scores. Show the site’s data before that of external studies. State the assumptions and present scenarios instead of a single number. Distinguish what can be measured, such as costs and technical metrics, from what remains an estimate, such as the increase in conversions. And propose a phased path, with a first limited and measurable intervention, which turns a bet into a series of verifiable decisions.
One last piece of advice concerns common language. Technical metrics should be translated into experiences that anyone in the company recognizes: “the product page on a smartphone appears after four seconds”, “the add to cart button responds with half a second of delay”, “the page shifts just as the customer is about to tap the button”. Accompanying the numbers with a short video of the site loading on a real mobile connection is often worth more than any chart: it makes the problem obvious to someone who has never heard of LCP, and prepares the ground for discussing the economic value of the solution.
In short
The economic return of a web performance project can be estimated seriously: by starting from your own site’s conversion rate by speed band, choosing a cautious improvement, applying it to the revenue model and comparing the result with margin, not revenue, and with all the costs, maintenance included. Three scenarios instead of one number, additional benefits on advertising, infrastructure and productivity, and rigorous verification after the intervention complete the picture.
Published studies say that speed matters; the site’s data says how much it matters for that site. Translating milliseconds into euros, honestly about the assumptions, is what turns performance from a technical topic into a business decision, as we have argued since the article on what web performance is.
